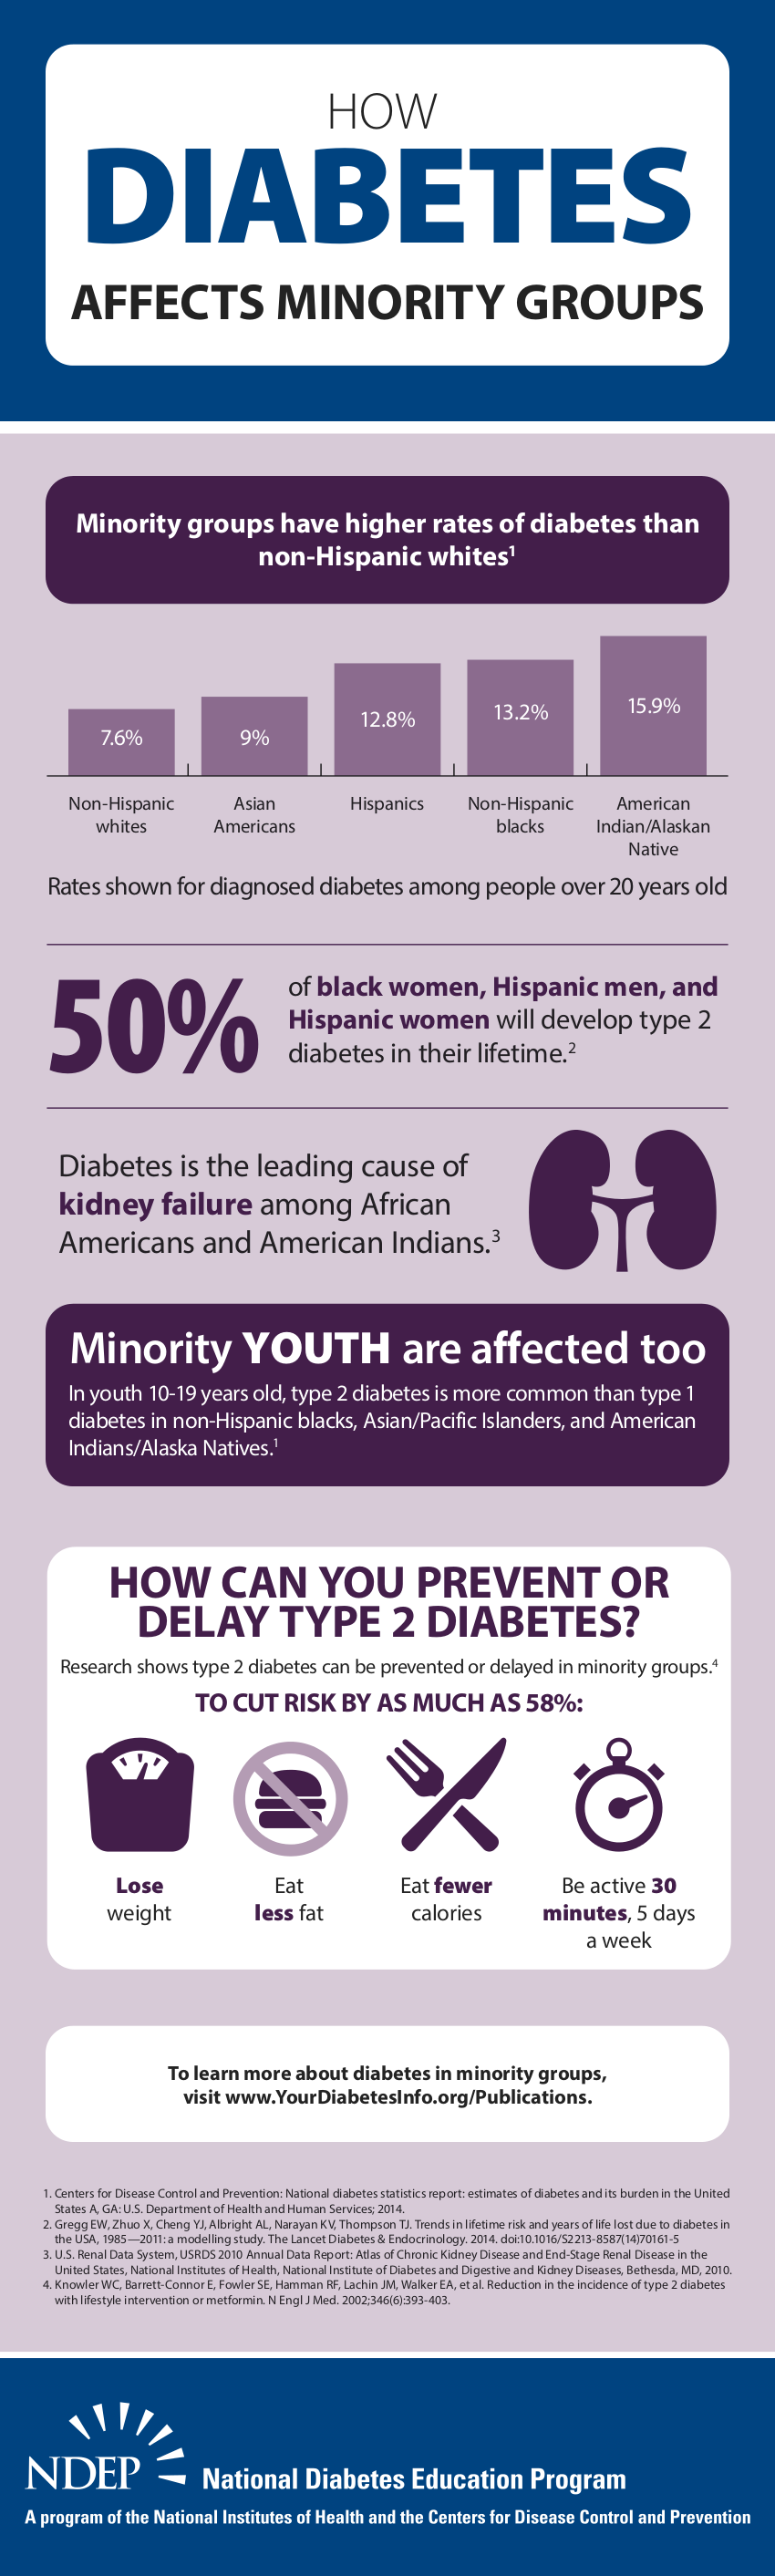
Skip to content
Logo: Mind Body Institute Beyond

Mind Body Institute Beyond

Advocating for a Better Everyday life for Everyday People.

  • Home
  • Employment
  • Internship
  • Clinical Services
    • About Us
    • The Company
    • Dr. David L. Mount
    • Contact Us
    • Disclaimers
  • The Dr. David L. Mount Center
    • NC Network
    • Community Reinvestment
      • Student Engagement
        • Health Equity Ambassadors
        • Intern or Volunteer
      • Community Champions
      • Community Recognition
      • Partnerships
        • Relationships & Networks
      • Health Listening Tour
      • Join the Revolution
      • Share a Community Health Revolution Story
      • Research
        • Publications
      • GuideRight
  • Chocolate City Studios
    • Products & Services
    • Our Videos
    • The Grind 4 Lyfe
    • Web Seminars
  • Talent Management
  • News
    • Latest Health News
      • Alzheimer’s Disease
      • Chronic Pain
      • Diabetes
      • Emotional Health
      • Hypertension
      • Kidney Disease
      • Nutrition Zone
      • Stroke
      • Tobacco Use
    • Media
  • Facebook
  • Google+
  • LinkedIn
  • Twitter
  • YouTube
  • Web Feed

Infographic: How Diabetes Affects Minority Groups

National Diabetes Education Program Infographic: How Diabetes Affects Minority Groups. Accessible PDF at http://www.niddk.nih.gov/health-information/health-topics/Diabetes/minority-groups-infographic/Documents/Diabetes-in-Minority-Groups_Infographic_508.pdf

National Diabetes Education Program (31 December 2014). “How Diabetes Affects Minority Groups.” [Infographic]. Bethesda, MD: National Institute of Diabetes and Digestive and Kidney Diseases.

Share this:

  • Print (Opens in new window) Print
  • Email a link to a friend (Opens in new window) Email
  • Share on X (Opens in new window) X
  • Share on LinkedIn (Opens in new window) LinkedIn
  • Share on Facebook (Opens in new window) Facebook
  • More
  • Share on Tumblr (Opens in new window) Tumblr
  • Share on Reddit (Opens in new window) Reddit
  • Share on Pinterest (Opens in new window) Pinterest
Author MindBodyInstituteBeyondPosted on February 29, 2016February 29, 2016Format ImageCategories DiabetesTags diabetes, health disparities, infographic, minority, prevention, race, statistics, visual

Post navigation

Previous Previous post: Taking Control of Diabetes
Next Next post: Nutrition.gov

Contact us about Jobs, Fellowships, Internships and Practicums!

RSS Diabetes News from Diabetes.co.uk

What’s New

  • Dr. Shelton Charles selected for Faculty eSIR Program.
    January 27, 2017
  • Truth Ain’t Popular Press Release
    January 27, 2017
  • Photograph: Mara Ramirez & Brianna SantosBrianna Santos of Winston-Salem selected for High School eScholar-in-Residence Program
    August 10, 2016
  • Sharing Your Story
    July 19, 2016
  • Home
  • Employment
  • Internship
  • Clinical Services
    • About Us
    • The Company
    • Dr. David L. Mount
    • Contact Us
    • Disclaimers
  • The Dr. David L. Mount Center
    • NC Network
    • Community Reinvestment
      • Student Engagement
        • Health Equity Ambassadors
        • Intern or Volunteer
      • Community Champions
      • Community Recognition
      • Partnerships
        • Relationships & Networks
      • Health Listening Tour
      • Join the Revolution
      • Share a Community Health Revolution Story
      • Research
        • Publications
      • GuideRight
  • Chocolate City Studios
    • Products & Services
    • Our Videos
    • The Grind 4 Lyfe
    • Web Seminars
  • Talent Management
  • News
    • Latest Health News
      • Alzheimer’s Disease
      • Chronic Pain
      • Diabetes
      • Emotional Health
      • Hypertension
      • Kidney Disease
      • Nutrition Zone
      • Stroke
      • Tobacco Use
    • Media
  • Facebook
  • Google+
  • LinkedIn
  • Twitter
  • YouTube
  • Web Feed
© Copyright 2011–2016 Mind Body Institute Beyond, PLLC. All Rights Reserved.